
Page 4 - Lesson Notes
P. 4
10m, when time is 4 sec the distance is 20m. We can say there is an equal increase
with equal intervals of time.
So, the information we get is:
Body is moving with uniform speed
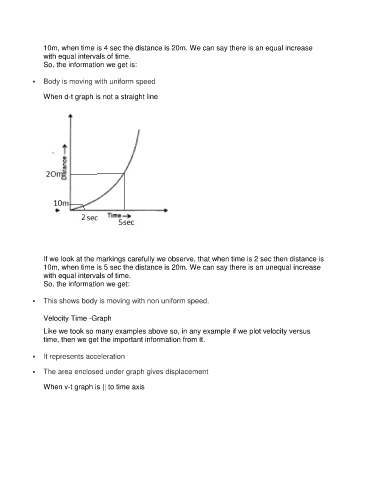
When d-t graph is not a straight line
If we look at the markings carefully we observe, that when time is 2 sec then distance is
10m, when time is 5 sec the distance is 20m. We can say there is an unequal increase
with equal intervals of time.
So, the information we get:
This shows body is moving with non uniform speed.
Velocity Time -Graph
Like we took so many examples above so, in any example if we plot velocity versus
time, then we get the important information from it.
It represents acceleration
The area enclosed under graph gives displacement
When v-t graph is || to time axis