
Page 2 - ws1
P. 2
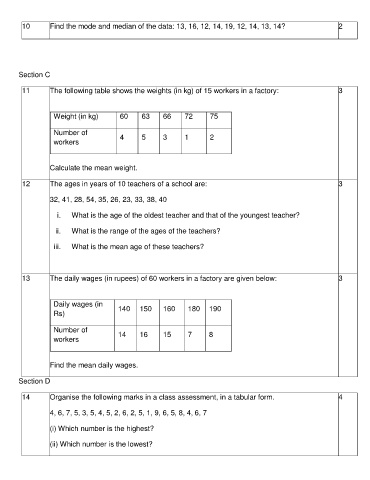
10        Find the mode and median of the data: 13, 16, 12, 14, 19, 12, 14, 13, 14?                      2


       Section C


        11        The following table shows the weights (in kg) of 15 workers in a factory:                      3


                   Weight (in kg)        60     63     66     72      75

                   Number of             4      5      3      1       2
                   workers


                  Calculate the mean weight.

        12        The ages in years of 10 teachers of a school are:                                              3

                  32, 41, 28, 54, 35, 26, 23, 33, 38, 40


                    i.   What is the age of the oldest teacher and that of the youngest teacher?

                   ii.   What is the range of the ages of the teachers?

                   iii.   What is the mean age of these teachers?


        13        The daily wages (in rupees) of 60 workers in a factory are given below:                        3


                   Daily wages (in
                   Rs)                  140    150     160     180  190

                   Number of            14     16      15      7      8
                   workers


                  Find the mean daily wages.


       Section D

        14        Organise the following marks in a class assessment, in a tabular form.                         4

                  4, 6, 7, 5, 3, 5, 4, 5, 2, 6, 2, 5, 1, 9, 6, 5, 8, 4, 6, 7


                  (i) Which number is the highest?

                  (ii) Which number is the lowest?