
Page 2 - ws1
P. 2
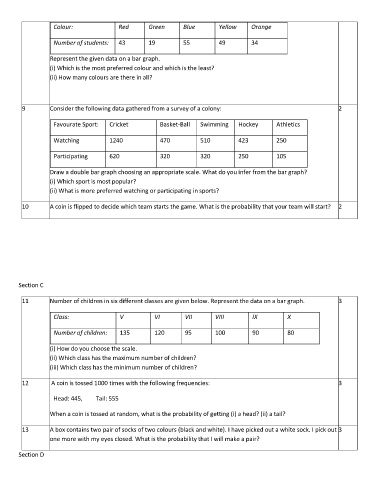
Colour:              Red       Green       Blue       Yellow     Orange

                   Number of students:   43       19          55         49         34


                  Represent the given data on a bar graph.
                  (i) Which is the most preferred colour and which is the least?
                  (ii) How many colours are there in all?


        9         Consider the following data gathered from a survey of a colony:                                2

                   Favourate Sport:   Cricket         Basket-Ball   Swimming    Hockey      Athletics

                   Watching          1240             470          510          423         250


                   Participating     620              320          320          250         105

                  Draw a double bar graph choosing an appropriate scale. What do you infer from the bar graph?
                  (i) Which sport is most popular?
                  (ii) What is more preferred watching or participating in sports?

        10        A coin is flipped to decide which team starts the game. What is the probability that your team will start?  2


       Section C


        11        Number of children in six different classes are given below. Represent the data on a bar graph.   3

                   Class:                V          VI        VII       VIII         IX         X

                   Number of children:   135        120       95        100          90         80

                  (i) How do you choose the scale.
                  (ii) Which class has the maximum number of children?
                  (iii) Which class has the minimum number of children?

        12         A coin is tossed 1000 times with the following frequencies:                                   3


                   Head: 445,    Tail: 555

                  When a coin is tossed at random, what is the probability of getting (i) a head? (ii) a tail?

        13        A box contains two pair of socks of two colours (black and white). I have picked out a white sock. I pick out 3
                  one more with my eyes closed. What is the probability that I will make a pair?

       Section D