Page 1 - ha1
P. 1

SAI International School

                                                      Grade-VII


               Mathematics


               CHAPTER-3: DATA HANDLING,


                HOME ASSIGNMENT -3


               SUBTOPICS: Bar Graph


               HOME ASSIGNMENT

               1. The following data shows the average age of men in various countries. Represent the

                       information with the help of a bar graph. (Use graph sheet )

                       Country                        China  Pakistan  India  U.K.  Nepal

                       Average age(in years)              60          50      52     70       55


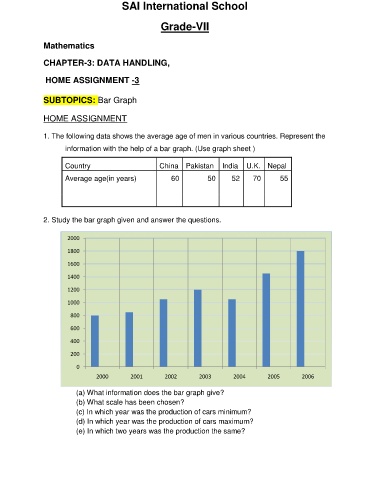
               2. Study the bar graph given and answer the questions.


                       2000
                       1800

                       1600
                       1400

                       1200

                       1000
                        800

                        600

                        400
                        200

                          0
                                 2000       2001        2002       2003       2004        2005       2006

                          (a) What information does the bar graph give?
                          (b) What scale has been chosen?
                          (c) In which year was the production of cars minimum?
                          (d) In which year was the production of cars maximum?
                          (e) In which two years was the production the same?
   1   2