
Page 6 - PPT
P. 6
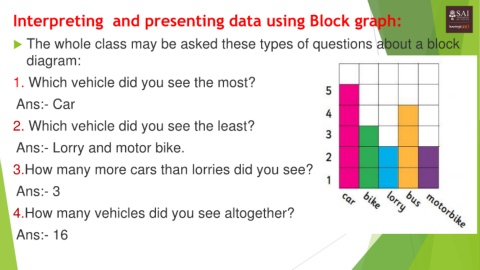
Interpreting and presenting data using Block graph:
The whole class may be asked these types of questions about a block
diagram:
1. Which vehicle did you see the most?
Ans:- Car
2. Which vehicle did you see the least?
Ans:- Lorry and motor bike.
3.How many more cars than lorries did you see?
Ans:- 3
4.How many vehicles did you see altogether?
Ans:- 16