
Page 2 - PPT
P. 2
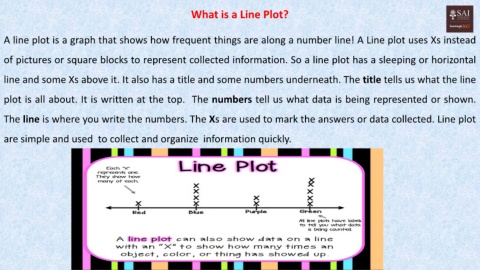
What is a Line Plot?


  A line plot is a graph that shows how frequent things are along a number line! A Line plot uses Xs instead


  of pictures or square blocks to represent collected information. So a line plot has a sleeping or horizontal


  line and some Xs above it. It also has a title and some numbers underneath. The title tells us what the line


  plot is all about. It is written at the top. The numbers tell us what data is being represented or shown.


  The line is where you write the numbers. The Xs are used to mark the answers or data collected. Line plot


  are simple and used to collect and organize information quickly.