
Page 14 - PPT
P. 14
Assignment:
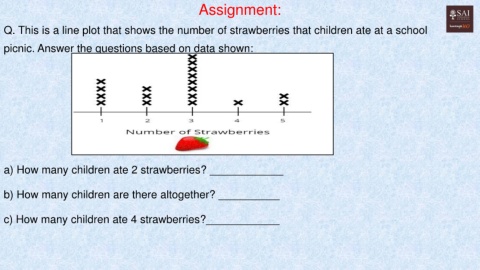
Q. This is a line plot that shows the number of strawberries that children ate at a school
picnic. Answer the questions based on data shown:
a) How many children ate 2 strawberries? ____________
b) How many children are there altogether? __________
c) How many children ate 4 strawberries?____________