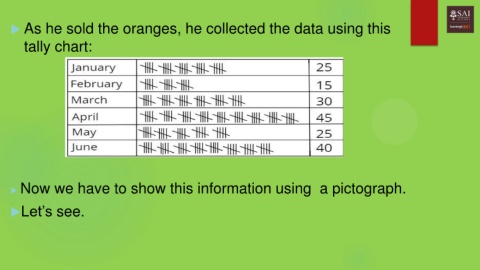
As he sold the oranges, he collected the data using this tally chart: Now we have to show this information using a pictograph. Let’s see.