
Page 5 - Lesson Note 12
P. 5
Market Supply Curve:
Market supply curve refers to a graphical representation of market supply
schedule. It is obtained by horizontal summation of individual supply curves.
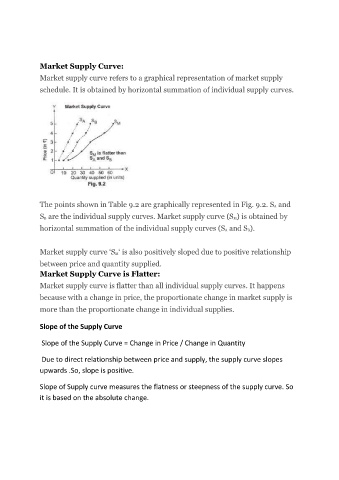
The points shown in Table 9.2 are graphically represented in Fig. 9.2. S A and
SB are the individual supply curves. Market supply curve (SM) is obtained by
horizontal summation of the individual supply curves (S A and S B).
Market supply curve ‘S M‘ is also positively sloped due to positive relationship
between price and quantity supplied.
Market Supply Curve is Flatter:
Market supply curve is flatter than all individual supply curves. It happens
because with a change in price, the proportionate change in market supply is
more than the proportionate change in individual supplies.
Slope of the Supply Curve
Slope of the Supply Curve = Change in Price / Change in Quantity
Due to direct relationship between price and supply, the supply curve slopes
upwards .So, slope is positive.
Slope of Supply curve measures the flatness or steepness of the supply curve. So
it is based on the absolute change.