
Page 1 - HA
P. 1
SAI International School
CLASS - X
Mathematics
CHAPTER-14: Statistics
HOME ASSIGNMENT-4
SUBTOPIC : Ogives (Graphical Representation of Cumulative
Frequency Distribution
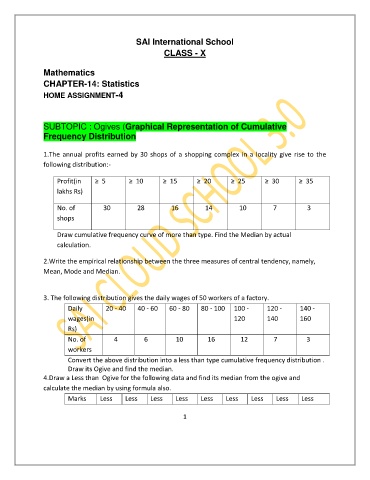
1.The annual profits earned by 30 shops of a shopping complex in a locality give rise to the
following distribution:-
Profit(in ≥ 5 ≥ 10 ≥ 15 ≥ 20 ≥ 25 ≥ 30 ≥ 35
lakhs Rs)
No. of 30 28 16 14 10 7 3
shops
Draw cumulative frequency curve of more than type. Find the Median by actual
calculation.
2.Write the empirical relationship between the three measures of central tendency, namely,
Mean, Mode and Median.
3. The following distribution gives the daily wages of 50 workers of a factory.
Daily 20 - 40 40 - 60 60 - 80 80 - 100 100 - 120 - 140 -
wages(in 120 140 160
Rs)
No. of 4 6 10 16 12 7 3
workers
Convert the above distribution into a less than type cumulative frequency distribution .
Draw its Ogive and find the median.
4.Draw a Less than Ogive for the following data and find its median from the ogive and
calculate the median by using formula also.
Marks Less Less Less Less Less Less Less Less Less
1