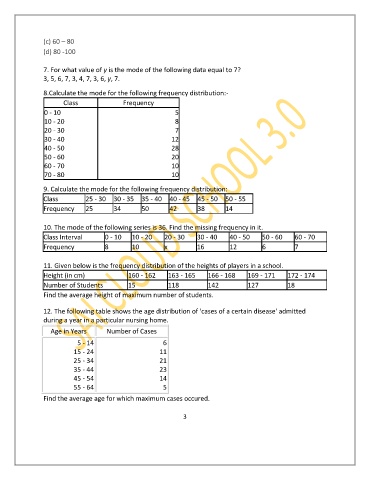
Page 3 - WS
P. 3

(c) 60 – 80
               (d) 80 -100


               7. For what value of y is the mode of the following data equal to 7?
               3, 5, 6, 7, 3, 4, 7, 3, 6, y, 7.
               8.Calculate the mode for the following frequency distribution:-
                      Class               Frequency
                0 - 10                                     5
                10 - 20                                    8
                20 - 30                                    7
                30 - 40                                   12
                40 - 50                                   28
                50 - 60                                   20
                60 - 70                                   10
                70 - 80                                   10

               9. Calculate the mode for the following frequency distribution:
               Class         25 - 30  30 - 35  35 - 40  40 - 45  45 - 50  50 - 55
               Frequency     25        34       50       42       38        14

               10. The mode of the following series is 36. Find the missing frequency in it.
               Class Interval       0 - 10   10 - 20   20 - 30    30 - 40    40 - 50    50 - 60    60 - 70
               Frequency            8        10        x          16         12         6          7

               11. Given below is the frequency distribution of the heights of players in a school.
               Height (in cm)              160 - 162     163 - 165    166 - 168    169 - 171    172 - 174
               Number of Students          15            118          142          127          18
               Find the average height of maximum number of students.


               12. The following table shows the age distribution of 'cases of a certain disease' admitted
               during a year in a particular nursing home.

                  Age in Years      Number of Cases
                           5 - 14                      6
                         15 - 24                      11
                         25 - 34                      21
                         35 - 44                      23
                         45 - 54                      14
                         55 - 64                       5

               Find the average age for which maximum cases occured.

                                                              3
   1   2   3   4