
Page 2 - HA
P. 2
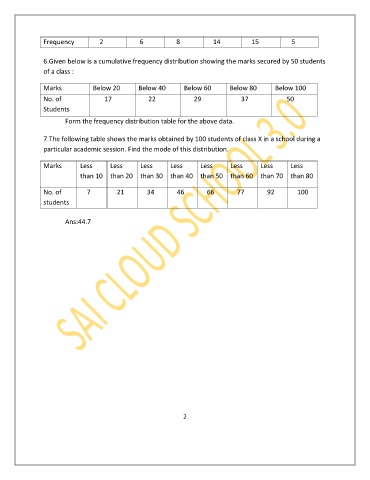
Frequency            2             6           8          14           15            5

               6.Given below is a cumulative frequency distribution showing the marks secured by 50 students
               of a class :


               Marks            Below 20       Below 40       Below 60       Below 80       Below 100
               No. of                  17            22             29              37             50
               Students
                       Form the frequency distribution table for the above data.

               7.The following table shows the marks obtained by 100 students of class X in a school during a
               particular academic session. Find the mode of this distribution.


               Marks        Less      Less     Less      Less      Less      Less      Less      Less
                            than 10  than 20  than 30  than 40  than 50  than 60  than 70  than 80

               No. of           7         21       34        46        66        77        92        100
               students

                       Ans:44.7


                                                              2