
Page 13 - Module
P. 13
This form of writing is used to interpret the facts presented in the form of table, graph or chart. A
graph or chart is a visual stimulus to depict the data. Data interpretation requires an analysis and
comparison of the given facts and drawing conclusions based on the given data.
SOLVED EXAMPLES:
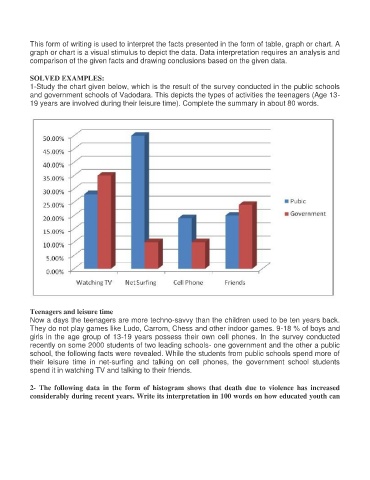
1-Study the chart given below, which is the result of the survey conducted in the public schools
and government schools of Vadodara. This depicts the types of activities the teenagers (Age 13-
19 years are involved during their leisure time). Complete the summary in about 80 words.
Teenagers and leisure time
Now a days the teenagers are more techno-savvy than the children used to be ten years back.
They do not play games like Ludo, Carrom, Chess and other indoor games. 9-18 % of boys and
girls in the age group of 13-19 years possess their own cell phones. In the survey conducted
recently on some 2000 students of two leading schools- one government and the other a public
school, the following facts were revealed. While the students from public schools spend more of
their leisure time in net-surfing and talking on cell phones, the government school students
spend it in watching TV and talking to their friends.
2- The following data in the form of histogram shows that death due to violence has increased
considerably during recent years. Write its interpretation in 100 words on how educated youth can