
Page 2 - CL-8 -CH-6 (CBQ)
P. 2
6 Double bar graphs display ______ sets of data simultaneously.
Answer: TWO
7 If 20-30 is the class interval of grouped data, then the lower class limit is-------------
Answer: 20
8 The difference between the upper-class limit and lower class limit of a class interval is
called:----------------
Answer: Width
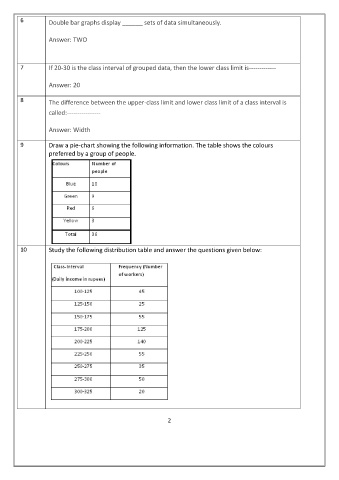
9 Draw a pie-chart showing the following information. The table shows the colours
preferred by a group of people.
10 Study the following distribution table and answer the questions given below:
2