
Page 1 - LN 4.5
P. 1
SAI INTERNATIONAL SCHOOL
CBSE CURRICULUM
Class: VI Lesson Note 4.5
SUBJECT: Mathematics
CH: 4- Data Handling and Representation
Sub Topic: Infographics
When data visualisations such as bar graphs are further beautified with
more extensive artistic and visual imagery, they are called information
graphics or infographics for short.
The aim of infographics is to make use of attention-attracting and
engaging visuals to communicate information even more clearly and
quickly, in a visually pleasing way.
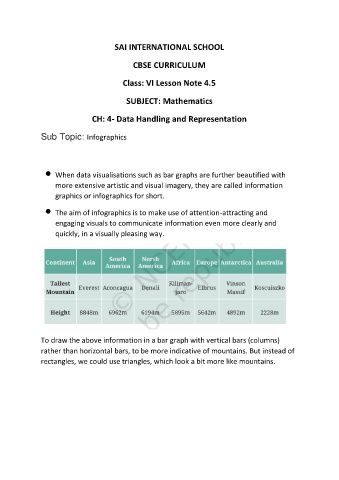
To draw the above information in a bar graph with vertical bars (columns)
rather than horizontal bars, to be more indicative of mountains. But instead of
rectangles, we could use triangles, which look a bit more like mountains.