
Page 1 - Carroll Diagram
P. 1
SAI International School
Class-III
LN- Carroll Diagram
Learning Objectives:
Students will be able to
• Understand what a Carroll Diagram is and how it is used.
• Identify and describe the properties used to sort data (e.g., even/odd, greater
than/less than).
• Sort objects, numbers, or information using two given criteria.
• Interpret information presented in a Carroll Diagram.
• Create their own Carroll Diagrams based on chosen properties.
What is a Carroll Diagram?
A Carroll Diagram is a way to sort and group objects, numbers, or information based on
yes/no questions or properties.
How Does It Work?
A Carroll Diagram has two rows and two columns, creating
four boxes.
Each row and column asks a yes/no or true/false question.
Example:
• "Even numbers" vs. "Not even numbers"
• "More than 10" vs. "10 or less"
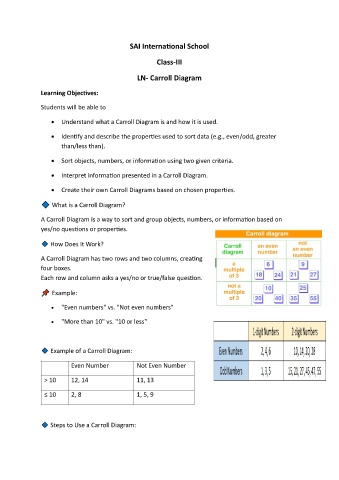
Example of a Carroll Diagram:
Even Number Not Even Number
> 10 12, 14 11, 13
≤ 10 2, 8 1, 5, 9
Steps to Use a Carroll Diagram: