
Page 4 - PPT(Venn diagram)
P. 4
Representation of Data using Venn
diagram:
We can express data by representing through venn diagram. When reading
Venn diagrams, the word "or" tells us to find the number in either circle, not
just the overlap.
Example:
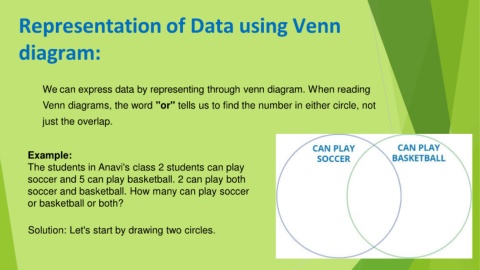
The students in Anavi's class 2 students can play
soccer and 5 can play basketball. 2 can play both
soccer and basketball. How many can play soccer
or basketball or both?
Solution: Let's start by drawing two circles.