
Page 18 - PPT-Tally chart and frequency table
P. 18
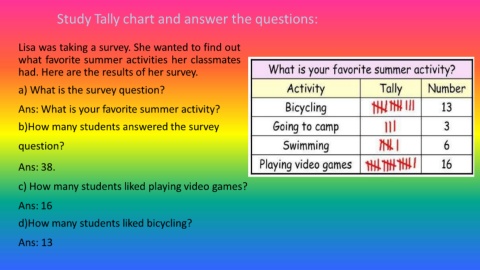
Study Tally chart and answer the questions:


        Lisa was taking a survey. She wanted to find out


        what favorite summer activities her classmates

        had. Here are the results of her survey.


        a) What is the survey question?


        Ans: What is your favorite summer activity?


        b)How many students answered the survey


        question?


        Ans: 38.


        c) How many students liked playing video games?


        Ans: 16


        d)How many students liked bicycling?


        Ans: 13