
Page 4 - X-CHEM-CBQ-CH-3
P. 4
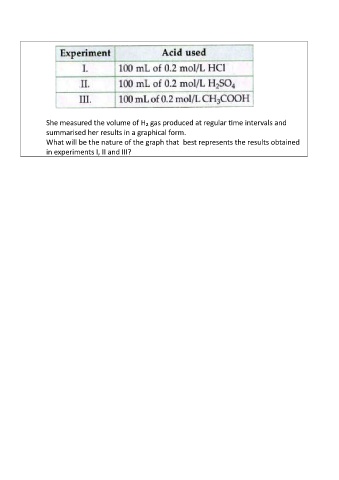
She measured the volume of H₂ gas produced at regular time intervals and
                 summarised her results in a graphical form.
                 What will be the nature of the graph that  best represents the results obtained
                 in experiments I, II and III?