
Page 2 - WorkSheet-2 Ch.14 Statistics
P. 2
scored by girls in a test is 73 (out of 100) and that of boys is 71. Determine the
mean score of the whole class.
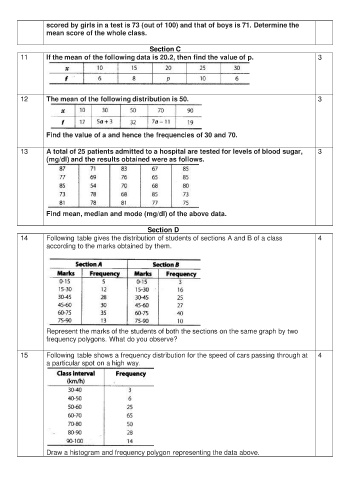
Section C
11 If the mean of the following data is 20.2, then find the value of p. 3
12 The mean of the following distribution is 50. 3
Find the value of a and hence the frequencies of 30 and 70.
13 A total of 25 patients admitted to a hospital are tested for levels of blood sugar, 3
(mg/dl) and the results obtained were as follows.
Find mean, median and mode (mg/dl) of the above data.
Section D
14 Following table gives the distribution of students of sections A and B of a class 4
according to the marks obtained by them.
Represent the marks of the students of both the sections on the same graph by two
frequency polygons. What do you observe?
15 Following table shows a frequency distribution for the speed of cars passing through at 4
a particular spot on a high way.
Draw a histogram and frequency polygon representing the data above.