
Page 2 - Home Assignment -3-Ch.14 Statistics Graphical Representation
P. 2
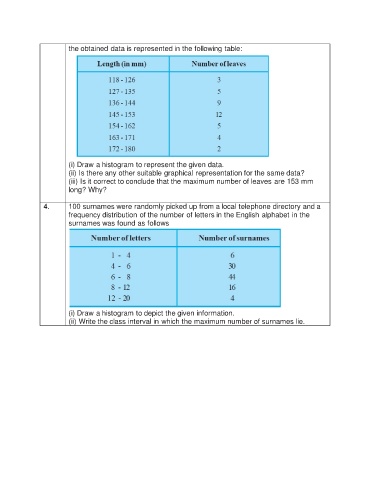
the obtained data is represented in the following table:


                        (i) Draw a histogram to represent the given data.
                        (ii) Is there any other suitable graphical representation for the same data?
                        (iii) Is it correct to conclude that the maximum number of leaves are 153 mm
                        long? Why?

               4.       100 surnames were randomly picked up from a local telephone directory and a
                        frequency distribution of the number of letters in the English alphabet in the
                        surnames was found as follows


                        (i) Draw a histogram to depict the given information.
                        (ii) Write the class interval in which the maximum number of surnames lie.