
Page 1 - Home Assignment -3-Ch.14 Statistics Graphical Representation
P. 1
SAI International Residential School
Class –IX
Mathematics
Ch.14: STATISTICS
Sub topics: Graphical Representation of Data,
Bar Graphs, Histogram
Home Assignment-3
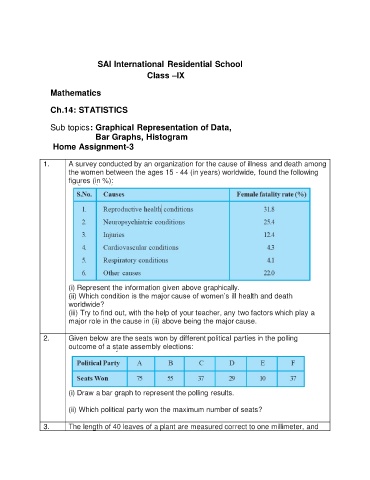
1. A survey conducted by an organization for the cause of illness and death among
the women between the ages 15 - 44 (in years) worldwide, found the following
figures (in %):
(i) Represent the information given above graphically.
(ii) Which condition is the major cause of women’s ill health and death
worldwide?
(iii) Try to find out, with the help of your teacher, any two factors which play a
major role in the cause in (ii) above being the major cause.
2. Given below are the seats won by different political parties in the polling
outcome of a state assembly elections:
(i) Draw a bar graph to represent the polling results.
(ii) Which political party won the maximum number of seats?
3. The length of 40 leaves of a plant are measured correct to one millimeter, and