
Page 2 - Home Assignment-2-Ch.14 Statistics( Frequency Distribution)
P. 2
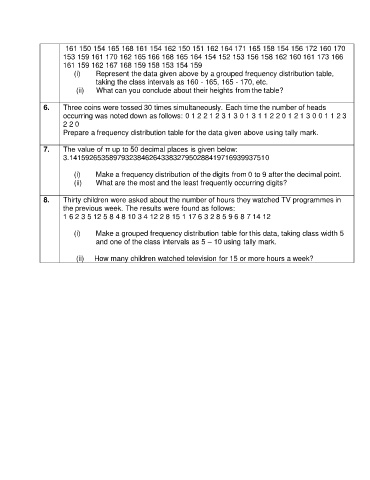
161 150 154 165 168 161 154 162 150 151 162 164 171 165 158 154 156 172 160 170
                      153 159 161 170 162 165 166 168 165 164 154 152 153 156 158 162 160 161 173 166
                      161 159 162 167 168 159 158 153 154 159
                          (i)    Represent the data given above by a grouped frequency distribution table,
                                 taking the class intervals as 160 - 165, 165 - 170, etc.
                           (ii)      What can you conclude about their heights from the table?

               6.     Three coins were tossed 30 times simultaneously. Each time the number of heads
                      occurring was noted down as follows: 0 1 2 2 1 2 3 1 3 0 1 3 1 1 2 2 0 1 2 1 3 0 0 1 1 2 3
                      2 2 0
                      Prepare a frequency distribution table for the data given above using tally mark.

               7.     The value of π up to 50 decimal places is given below:
                      3.14159265358979323846264338327950288419716939937510

                          (i)    Make a frequency distribution of the digits from 0 to 9 after the decimal point.
                          (ii)   What are the most and the least frequently occurring digits?

               8.     Thirty children were asked about the number of hours they watched TV programmes in
                      the previous week. The results were found as follows:
                      1 6 2 3 5 12 5 8 4 8 10 3 4 12 2 8 15 1 17 6 3 2 8 5 9 6 8 7 14 12

                          (i)    Make a grouped frequency distribution table for this data, taking class width 5
                                 and one of the class intervals as 5 – 10 using tally mark.

                           (ii)     How many children watched television for 15 or more hours a week?