
Page 1 - Home Assignment-2-Ch.14 Statistics( Frequency Distribution)
P. 1
SAI International Residential School
Class –IX
Mathematics
Chapter-14: STATISTICS
Sub topics: Frequency distribution table,
Ungrouped frequency distribution table, Grouped frequency
distribution table.
Home Assignment-2
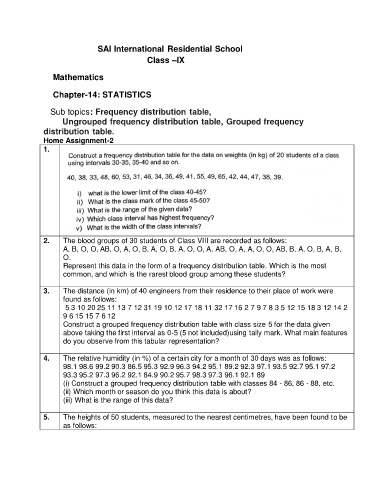
1.
2. The blood groups of 30 students of Class VIII are recorded as follows:
A, B, O, O, AB, O, A, O, B, A, O, B, A, O, O, A, AB, O, A, A, O, O, AB, B, A, O, B, A, B,
O.
Represent this data in the form of a frequency distribution table. Which is the most
common, and which is the rarest blood group among these students?
3. The distance (in km) of 40 engineers from their residence to their place of work were
found as follows:
5 3 10 20 25 11 13 7 12 31 19 10 12 17 18 11 32 17 16 2 7 9 7 8 3 5 12 15 18 3 12 14 2
9 6 15 15 7 6 12
Construct a grouped frequency distribution table with class size 5 for the data given
above taking the first interval as 0-5 (5 not included)using tally mark. What main features
do you observe from this tabular representation?
4. The relative humidity (in %) of a certain city for a month of 30 days was as follows:
98.1 98.6 99.2 90.3 86.5 95.3 92.9 96.3 94.2 95.1 89.2 92.3 97.1 93.5 92.7 95.1 97.2
93.3 95.2 97.3 96.2 92.1 84.9 90.2 95.7 98.3 97.3 96.1 92.1 89
(i) Construct a grouped frequency distribution table with classes 84 - 86, 86 - 88, etc.
(ii) Which month or season do you think this data is about?
(iii) What is the range of this data?
5. The heights of 50 students, measured to the nearest centimetres, have been found to be
as follows: