
Page 3 - LN
P. 3
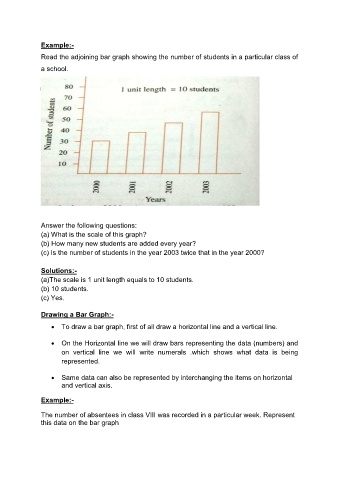
Example:-
Read the adjoining bar graph showing the number of students in a particular class of
a school.
Answer the following questions:
(a) What is the scale of this graph?
(b) How many new students are added every year?
(c) Is the number of students in the year 2003 twice that in the year 2000?
Solutions:-
(a)The scale is 1 unit length equals to 10 students.
(b) 10 students.
(c) Yes.
Drawing a Bar Graph:-
To draw a bar graph, first of all draw a horizontal line and a vertical line.
On the Horizontal line we will draw bars representing the data (numbers) and
on vertical line we will write numerals .which shows what data is being
represented.
Same data can also be represented by interchanging the items on horizontal
and vertical axis.
Example:-
The number of absentees in class VIII was recorded in a particular week. Represent
this data on the bar graph