
Page 2 - LN
P. 2
Drawing a Pictograph:-
Drawing a pictograph is interesting. We can use simpler symbols to represents the
data.
Example:-
The following are the number of electric bulbs purchased for a lodging house during
the first four months of a year.
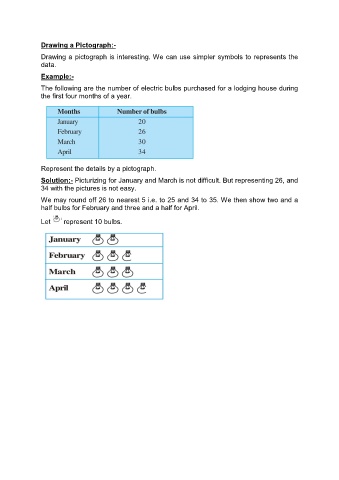
Represent the details by a pictograph.
Solution:- Picturizing for January and March is not difficult. But representing 26, and
34 with the pictures is not easy.
We may round off 26 to nearest 5 i.e. to 25 and 34 to 35. We then show two and a
half bulbs for February and three and a half for April.
Let represent 10 bulbs.