
Page 1 - LN
P. 1
SAI International School
CLASS-VI
Mathematics
CHAPTER-9: Data Handling
Lesson Notes-2
SUBTOPIC: Pictograph
Pictograph: A pictograph represents data through pictures of objects. It helps to
answer the questions on the data at glance.
Example:-
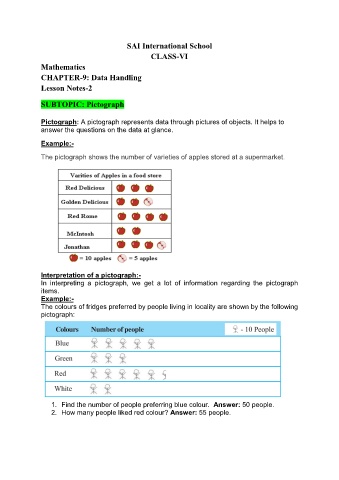
The pictograph shows the number of varieties of apples stored at a supermarket.
Interpretation of a pictograph:-
In interpreting a pictograph, we get a lot of information regarding the pictograph
items.
Example:-
The colours of fridges preferred by people living in locality are shown by the following
pictograph:
1. Find the number of people preferring blue colour. Answer: 50 people.
2. How many people liked red colour? Answer: 55 people.