
Page 2 - HA 2
P. 2
Objective Questions:
1. The pictorial representation of the data is called____________.
a. Tally Graph
b. Pictograph
c. Bar Graph
d. Pie Chart
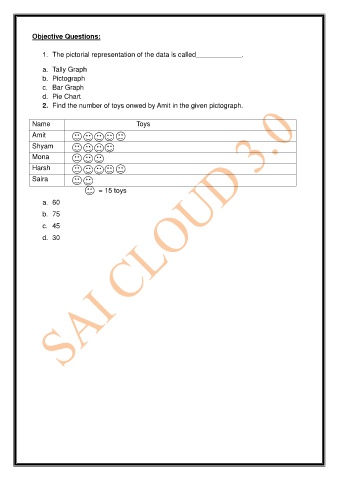
2. Find the number of toys onwed by Amit in the given pictograph.
Name Toys
Amit
Shyam
Mona
Harsh
Saira
= 15 toys
a. 60
b. 75
c. 45
d. 30