
Page 2 - HA 3
P. 2
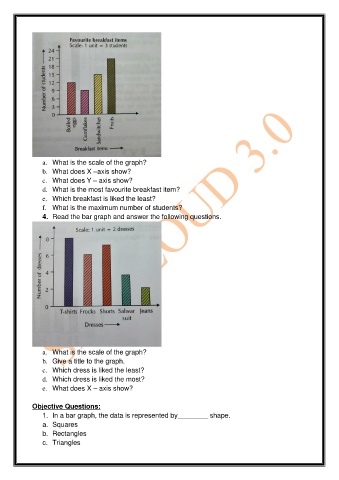
a.  What is the scale of the graph?
                b.  What does X –axis show?
                c.  What does Y – axis show?
                d.  What is the most favourite breakfast item?
                e.  Which breakfast is liked the least?
                f.  What is the maximum number of students?
                4.  Read the bar graph and answer the following questions.


                a.  What is the scale of the graph?
                b.  Give a title to the graph.
                c.  Which dress is liked the least?
                d.  Which dress is liked the most?
                e.  What does X – axis show?

            Objective Questions:
                1.  In a bar graph, the data is represented by________ shape.
                a.  Squares
                b.  Rectangles
                c.  Triangles