
Page 1 - LN 3
P. 1
SAI International School
Sub – Mathematics
Class - IV
Topic – Data Handling
Sub-topic 12.3 : - Bar Graph
• A graph that uses bars to represent data is called Bar Graph.
• In a bar graph, the numerical data is represented by rectangular bars.
• The rectangular bars must have equal width.
• The rectangular bars are of various heights depending upon the data.
• A Bar Graph uses a scale.
• A Bar Graph has two axes.
✓ X – Axis
✓ Y – Axis
** We will learn to interpret the data in a bar graph.
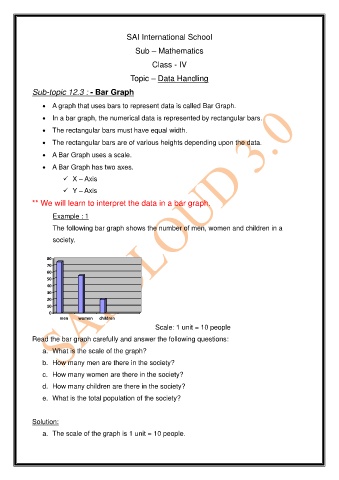
Example : 1
The following bar graph shows the number of men, women and children in a
society.
80
70
60
50
40
30
20
10
0
men women children
Scale: 1 unit = 10 people
Read the bar graph carefully and answer the following questions:
a. What is the scale of the graph?
b. How many men are there in the society?
c. How many women are there in the society?
d. How many children are there in the society?
e. What is the total population of the society?
Solution:
a. The scale of the graph is 1 unit = 10 people.