
Page 2 - LN
P. 2
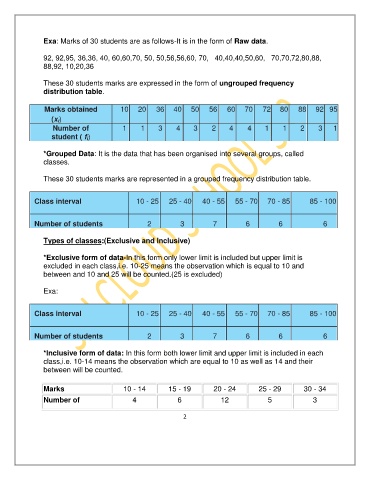
Exa: Marks of 30 students are as follows-It is in the form of Raw data.

               92, 92,95, 36,36, 40, 60,60,70, 50, 50,56,56,60, 70,   40,40,40,50,60,   70,70,72,80,88,
               88,92, 10,20,36

               These 30 students marks are expressed in the form of ungrouped frequency
               distribution table.


                Marks obtained           10    20    36   40    50    56    60    70    72    80    88   92  95
                  (x i)
                  Number of               1     1    3     4     3     2     4     4     1     1    2     3    1
                  student ( f i)


               *Grouped Data: It is the data that has been organised into several groups, called
               classes.


               These 30 students marks are represented in a grouped frequency distribution table.


            Class interval                    10 - 25    25 - 40    40 - 55    55 - 70    70 - 85      85 - 100


            Number of students                    2          3         7          6          6              6


               Types of classes:(Exclusive and Inclusive)

               *Exclusive form of data-In this form only lower limit is included but upper limit is
               excluded in each class,i.e. 10-25 means the observation which is equal to 10 and
               between and 10 and 25 will be counted.(25 is excluded)

               Exa:


            Class interval                    10 - 25    25 - 40    40 - 55    55 - 70    70 - 85      85 - 100

            Number of students                    2          3         7          6          6              6


               *Inclusive form of data: In this form both lower limit and upper limit is included in each
               class,i.e. 10-14 means the observation which are equal to 10 as well as 14 and their
               between will be counted.


               Marks                      10 - 14        15 - 19        20 - 24        25 - 29        30 - 34

               Number of                     4              6             12              5              3

                                                              2