
Page 1 - Worksheet - 2
P. 1
SAI International School
CLASS - VIII
Mathematics
CHAPTER-1: Data handling-1
WORKSHEET – 2
SUBTOPIC :introduction with bar graph
Select the most appropriate answer from the given options.
1. The shoppers who come to a departmental store are marked as: man (M), woman (W),
boy (B) or girl (G). The following list gives the shoppers who came during the first
hour in the morning.
W WW G B W W M G G M M W WWW G B M W B G G M W W M M W WW M
W B W G M W WWW G W M M W M W G W M G W M M B G G W.
Make a frequency distribution table using tally marks.
2. The weekly wages (in `) of 30 workers in a factory are:
830, 835, 890, 810, 835, 836, 869, 845, 898, 890, 820, 860, 832, 833, 855, 845, 804,
808, 812, 840, 885, 835, 835, 836, 878, 840, 868, 890, 806, 840.
Using tally marks, make a frequency table with intervals as 800 – 810, 810 – 820 and
so on.
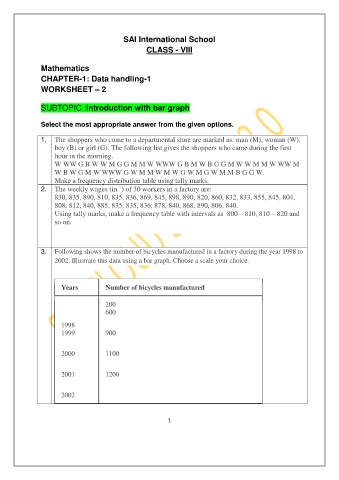
3. Following shows the number of bicycles manufactured in a factory during the year 1998 to
2002. Illustrate this data using a bar graph. Choose a scale your choice.
Years Number of bicycles manufactured
200
600
1998
1999 900
2000 1100
2001 1200
2002
1