
Page 2 - ln1
P. 2
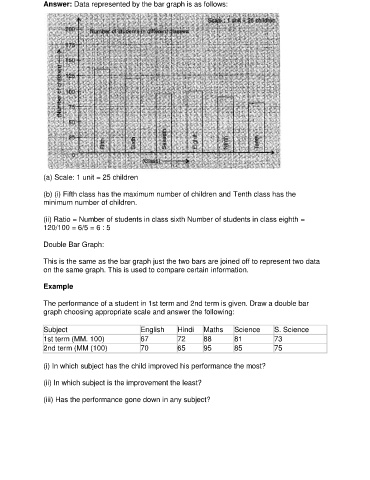
Answer: Data represented by the bar graph is as follows:


               (a) Scale: 1 unit = 25 children

               (b) (i) Fifth class has the maximum number of children and Tenth class has the
               minimum number of children.

               (ii) Ratio = Number of students in class sixth Number of students in class eighth =
               120/100 = 6/5 = 6 : 5


               Double Bar Graph:

               This is the same as the bar graph just the two bars are joined off to represent two data
               on the same graph. This is used to compare certain information.

               Example


               The performance of a student in 1st term and 2nd term is given. Draw a double bar
               graph choosing appropriate scale and answer the following:

               Subject                          English     Hindi   Maths      Science      S. Science
               1st term (MM. 100)               67          72      88         81           73
               2nd term (MM (100)               70          65      95         85           75


               (i) In which subject has the child improved his performance the most?

               (ii) In which subject is the improvement the least?


               (iii) Has the performance gone down in any subject?