
Page 1 - Work Sheet-1 Ch.14 Statistics
P. 1
SAI INTERNATIONAL RESIDENTIAL SCHOOL
Class: IX
Worksheet No.1 (Statistics)
Subject -Mathematics
Section A
Choose the correct option:
1 The class mark of the class 90-120 is 1
(a) 90 (b) 105 (c) 115 (d) 120
2 The range of the data 25, 18, 20, 22, 16, 6, 17, 15, 12, 30, 32, 10, 19, 8, 11 and 20 is 1
(a) 10 (b) 15 (c) 18 (d) 26
3 In a frequency distribution, the mid value of a class is 10 and the width of the class is 6. 1
The lower limit of the class is
(a) 6 (b) 7 (c) 8 (d) 12
Fill in the Blanks:
4 The width of each of five continuous classes in a frequency distribution is 5 and the 1
lower-class limit of the lowest class is 10. The upper-class limit of the highest class is
________
5 If m is the mid-point and l is the upper-class limit of a class in a continuous frequency 1
distribution, then lower-class limit of the class is __________
Answer the following
6 In the class intervals 10-20, 20-30, the number 20 is included in which class? 1
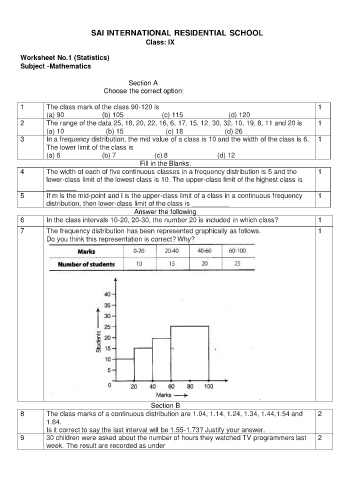
7 The frequency distribution has been represented graphically as follows. 1
Do you think this representation is correct? Why?
.
Section B
8 The class marks of a continuous distribution are 1.04, 1.14, 1.24, 1.34, 1.44,1.54 and 2
1.64.
Is it correct to say the last interval will be 1.55-1.73? Justify your answer.
9 30 children were asked about the number of hours they watched TV programmers last 2
week. The result are recorded as under