
Page 1 - Home Assignment-1 -Ch.14 Statistics(Itroduction,Presentation of data)
P. 1
SAI International Residential School
Class –IX
Mathematics
Chapter-14: statistics
Home Assignment-1
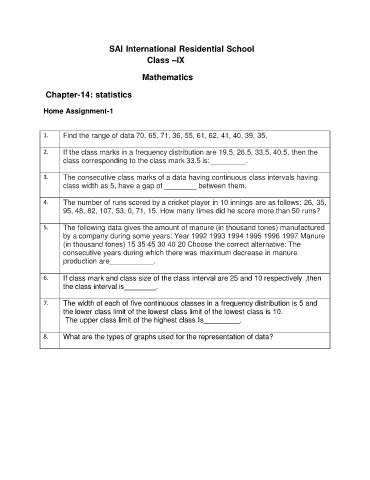
1. Find the range of data 70, 65, 71, 36, 55, 61, 62, 41, 40, 39, 35.
2. If the class marks in a frequency distribution are 19.5, 26.5, 33.5, 40.5, then the
class corresponding to the class mark 33.5 is:_________.
3. The consecutive class marks of a data having continuous class intervals having
class width as 5, have a gap of ________ between them.
4. The number of runs scored by a cricket player in 10 innings are as follows: 26, 35,
95, 48, 82, 107, 53, 0, 71, 15. How many times did he score more than 50 runs?
5. The following data gives the amount of manure (in thousand tones) manufactured
by a company during some years: Year 1992 1993 1994 1995 1996 1997 Manure
(in thousand tones) 15 35 45 30 40 20 Choose the correct alternative: The
consecutive years during which there was maximum decrease in manure
production are___________.
6. If class mark and class size of the class interval are 25 and 10 respectively ,then
the class interval is________.
7. The width of each of five continuous classes in a frequency distribution is 5 and
the lower class limit of the lowest class limit of the lowest class is 10.
The upper class limit of the highest class Is_________.
8. What are the types of graphs used for the representation of data?