Page 1 - SLRC-std 8-Geog-Chap-6-Human Resources-Subtopic-4-Popu compo pyramid-MM
P. 1

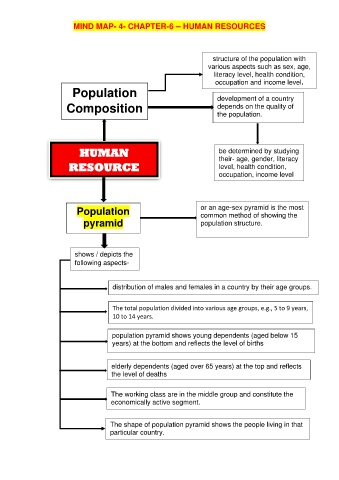
MIND MAP- 4- CHAPTER-6 – HUMAN RESOURCES


                                                                            structure of the population with
                                                                          various aspects such as sex, age,
                                                                            literacy level, health condition,

                                                                             occupation and income level.
                          Population

                        Composition                                          development of a country
                                                                             depends on the quality of
                                                                             the population.


                             HUMAN                                            be determined by studying
                          RESOURCE                                            their- age, gender, literacy

                                                                              level, health condition,
                                                                              occupation, income level


                                                                       or an age-sex pyramid is the most
                            Population                                 common method of showing the
                                                                       population structure.
                              pyramid


                           shows / depicts the
                                     following aspects-


                                         distribution of males and females in a country by their age groups.


                                         The total population divided into various age groups, e.g., 5 to 9 years,
                                         10 to 14 years.


                                        population pyramid shows young dependents (aged below 15

                                        years) at the bottom and reflects the level of births


                                        elderly dependents (aged over 65 years) at the top and reflects
                                        the level of deaths


                                        The working class are in the middle group and constitute the

                                        economically active segment.


                                        The shape of population pyramid shows the people living in that
                                        particular country.
   1