
Page 1 - HA
P. 1
SAI International School
CLASS-VI
Mathematics
CHAPTER-9: Data Handling
Home Assignment-2
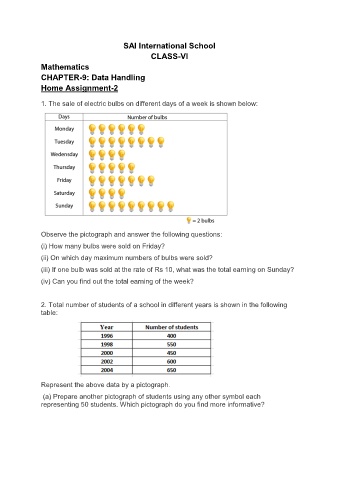
1. The sale of electric bulbs on different days of a week is shown below:
Observe the pictograph and answer the following questions:
(i) How many bulbs were sold on Friday?
(ii) On which day maximum numbers of bulbs were sold?
(iii) If one bulb was sold at the rate of Rs 10, what was the total earning on Sunday?
(iv) Can you find out the total earning of the week?
2. Total number of students of a school in different years is shown in the following
table:
Represent the above data by a pictograph.
(a) Prepare another pictograph of students using any other symbol each
representing 50 students. Which pictograph do you find more informative?