
Page 1 - LN 5
P. 1
SAI International School
Sub – Mathematics
Class - V
Topic – Data Handling
Sub-topic 14.5: - Line Graph
➢ Line graph can be drawn by joining the dots for the values in the given data.
Or
➢ A graph that shows information that is connected in some way.
➢ Line graph are used to show the difference of progress of something over a period
of time.
➢ This shows the data as points connected by a line.
** We will learn to interpret the line graph.
Example: 1
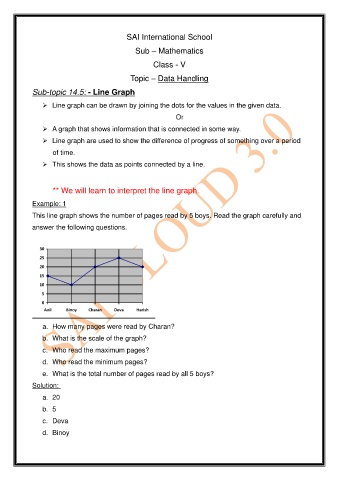
This line graph shows the number of pages read by 5 boys. Read the graph carefully and
answer the following questions.
30
25
20
15
10
5
0
Anil Binoy Charan Deva Harish
a. How many pages were read by Charan?
b. What is the scale of the graph?
c. Who read the maximum pages?
d. Who read the minimum pages?
e. What is the total number of pages read by all 5 boys?
Solution:
a. 20
b. 5
c. Deva
d. Binoy