
Page 1 - HA 3
P. 1
SAI International School
Sub – Mathematics
Class - IV
Topic – Data Handling
Sub-topic 12.3 : - Bar Graph
Practice Time:
Subjective Questions:
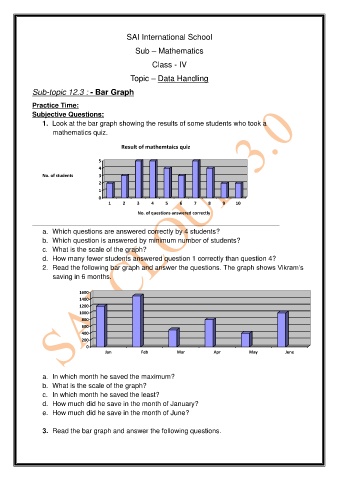
1. Look at the bar graph showing the results of some students who took a
mathematics quiz.
Result of mathemtaics quiz
5
4
No. of students 3
2
1
0
1 2 3 4 5 6 7 8 9 10
No. of questions answered correctly
a. Which questions are answered correctly by 4 students?
b. Which question is answered by minimum number of students?
c. What is the scale of the graph?
d. How many fewer students answered question 1 correctly than question 4?
2. Read the following bar graph and answer the questions. The graph shows Vikram’s
saving in 6 months.
1600
1400
1200
1000
800
600
400
200
0
Jan Feb Mar Apr May June
a. In which month he saved the maximum?
b. What is the scale of the graph?
c. In which month he saved the least?
d. How much did he save in the month of January?
e. How much did he save in the month of June?
3. Read the bar graph and answer the following questions.