
Page 1 - LN 1
P. 1
SAI International School
Sub – Mathematics
Class - V
Topic – Data Handling
Sub-topic 14.1 : - Introduction to Data Handling & Tally Graph
Introduction:
The information collected is known as data.
The collection of information in the form of numerical figures is known as numerical data.
We organise and represent the data in various ways.
The various ways are:
1. Tally Graph(Tally Table)
2. Pictograph
3. Bar Graph
4. Pie Chart(Circle Chart)
5. Line Graph
Let us discuss:
1. Tally Graph(Tally Table)
➢ A tally chart is drawn by drawing the number of lines for each value in the data.
➢ The number of times an observation occurs in the data is called the frequency.
➢ The lines used to show the frequency in a data are called tally marks.
➢ Tally marks are drawn in a bunch of 5.
➢ 1 tally mark represents one observation.
➢ 4 lines (vertical) are drawn side by side to denote 4(IIII). 5 is denoted by crossing
the four vertical lines ( IIII )
Examples:
4 – IIII
5 – IIII
6 – IIII I
7 – IIII II
Let us learn to draw tally table or tally graph.
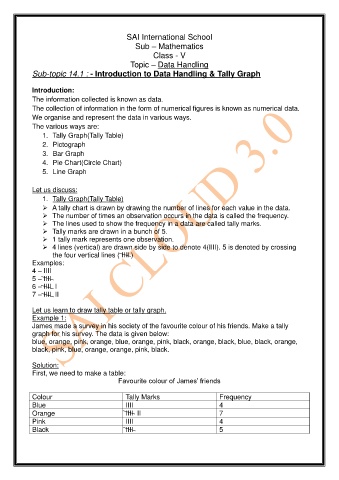
Example 1:
James made a survey in his society of the favourite colour of his friends. Make a tally
graph for his survey. The data is given below:
blue, orange, pink, orange, blue, orange, pink, black, orange, black, blue, black, orange,
black, pink, blue, orange, orange, pink, black.
Solution:
First, we need to make a table:
Favourite colour of James’ friends
Colour Tally Marks Frequency
Blue IIII 4
Orange IIII II 7
Pink IIII 4
Black IIII 5