
Page 1 - LN 4
P. 1
SAI International School
Sub – Mathematics
Class - IV
Topic – Data Handling
Sub-topic 12.4: - Pie Chart
Pie Graph is a ‘circular graph’. In pie graph, a circle is divided into the required number of
parts to represent the given information.
Or
A pie chart is a type of graph in which a circle is divided into different parts.
Each part represents a portion (part) of a whole.
Each part of a pie chart is known as sector.
** We will learn to interpret the pie chart.
Example: 1
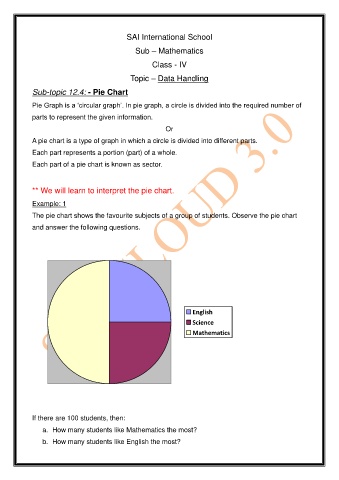
The pie chart shows the favourite subjects of a group of students. Observe the pie chart
and answer the following questions.
English
Science
Mathematics
If there are 100 students, then:
a. How many students like Mathematics the most?
b. How many students like English the most?