
Page 1 - LN 2
P. 1
SAI International School
Sub – Mathematics
Class - IV
Topic – Data Handling
Sub-topic 12.2 : - Pictograph
When the data is represented using pictures, it is known as pictograph.
Or
The pictorial representation of data is known as pictograph.
Or
Pictures that represent information are called pictograph.
We use scales to represent the data.
e.g. 1 = 5 glasses
e.g. 2 = 2 pages
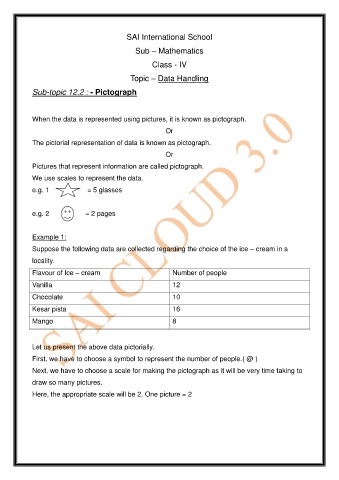
Example 1:
Suppose the following data are collected regarding the choice of the ice – cream in a
locality.
Flavour of Ice – cream Number of people
Vanilla 12
Chocolate 10
Kesar pista 16
Mango 8
Let us present the above data pictorially.
First, we have to choose a symbol to represent the number of people.( @ )
Next, we have to choose a scale for making the pictograph as it will be very time taking to
draw so many pictures.
Here, the appropriate scale will be 2. One picture = 2